On this page
You will, eventually, have a service go down without noticing. The photo backup silently stops. The media server is dead when guests arrive. A container crashed on Tuesday and you find out Friday. The cloud providers you’re replacing had one thing you don’t yet: someone watching, all the time.
Uptime Kuma is that someone. It’s a self-hosted monitor that pings your services on a schedule and pokes you — on your phone, in Discord, wherever — the second something goes down. It takes about five minutes to set up, and it’s usually the very first monitoring tool people install, long before the heavier Prometheus-and-Grafana stack.
Install it in one command
Uptime Kuma is a single container. Give it a volume so your monitors and history survive restarts, and publish its port.
docker run -d \
--name uptime-kuma \
--restart=unless-stopped \
-p 3001:3001 \
-v uptime-kuma:/app/data \
louislam/uptime-kuma:2
Prefer Compose (recommended, so it lives alongside your other stacks)? Same thing, in a file:
services:
uptime-kuma:
  image: louislam/uptime-kuma:2
  container_name: uptime-kuma
  ports:
    - "3001:3001"
  volumes:
    - uptime-kuma:/app/data
  restart: unless-stopped

volumes:
uptime-kuma:
The louislam/uptime-kuma:2 tag pins the current major version (version 2). Pinning to a major tag means you get bug fixes and minor updates on docker compose pull without being surprised by a future breaking major release. New to compose files? Start with Your First Docker Compose Stack.
Bring it up (docker compose up -d) and open http://YOUR-HOST-IP:3001. The first screen creates your admin account. That’s the entire install — no config files.
Add your first monitors
Everything from here is point-and-click. Hit Add New Monitor and fill in a few fields.
Set the type to HTTP(s) and paste a service URL, e.g. http://192.168.1.30:8096 for Jellyfin. Uptime Kuma checks it every 60 seconds (adjustable) and records whether it responds and how quickly.
For your Proxmox host, router, or NAS, use a Ping monitor (is it reachable?) or a TCP Port monitor (is port 22 / 445 / 8006 open?). Great for anything that doesn’t serve a webpage.
Add a Ping monitor to 1.1.1.1 or 8.8.8.8. Now if your uplink drops, you’ll have a clear record of exactly when — invaluable for arguing with your ISP.
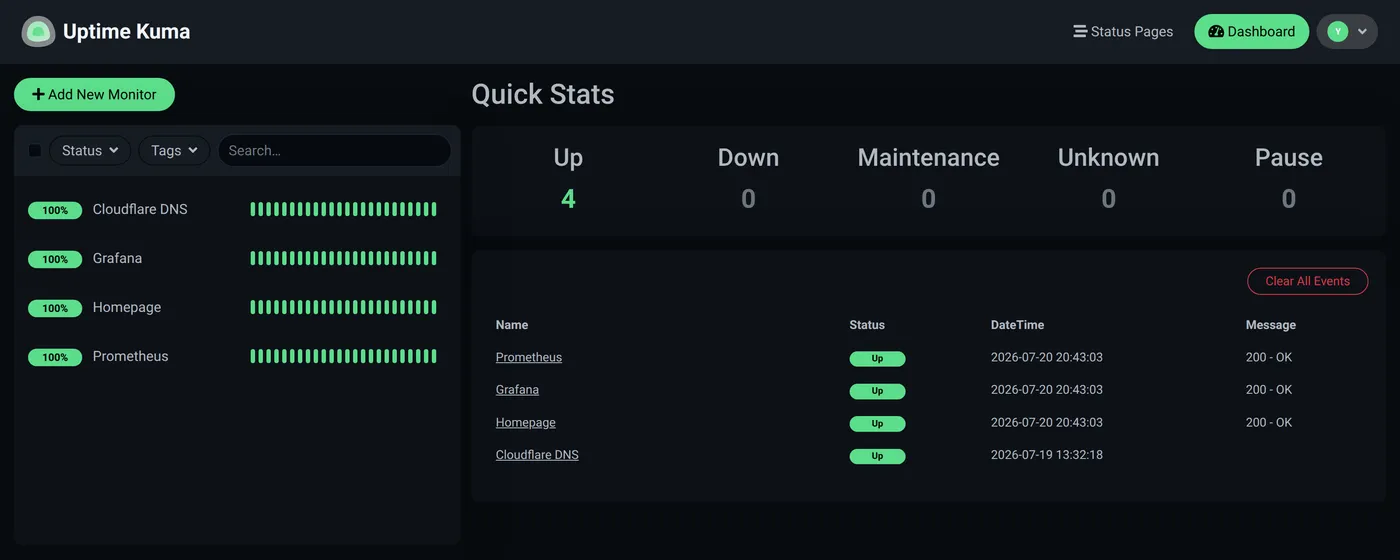
A few monitors later, the dashboard starts earning its keep — every green segment is one successful check, and the moment anything fails you’ll see exactly when the run of green stops:
An HTTP(s) monitor on an HTTPS URL also tracks the certificate’s expiry date and can warn you before it lapses. If you set up HTTPS with Traefik, this quietly guards against the classic “the cert expired and everything broke” Saturday.
Get notified before your users do
A dashboard you have to look at isn’t monitoring — it’s a screensaver. The real value is the alert. Go to Settings → Notifications → Setup Notification and pick a channel: Uptime Kuma supports Discord, Telegram, email (SMTP), Slack, ntfy, Gotify, Pushover, and dozens more.
Choose your channel (Telegram and Discord are the easiest — paste a bot token or a webhook URL), give it a name, and send the test message to confirm it arrives.
Enable that notification on each monitor (or set it as default for new ones). Now, the moment a service fails a check, your phone buzzes — and buzzes again when it recovers, so you know it’s back.
Bonus: a status page for the household
Uptime Kuma can publish a status page — a clean, shareable page showing which services are up. Make one for your family (“is the movie server working?”) so they can check for themselves instead of asking you. You choose exactly which monitors appear, and it can be public or kept private on your LAN.
Where it fits in the bigger picture
Uptime Kuma answers “is it up?” brilliantly and instantly. When you later want “why is it slow, and what’s the trend over three months?”, that’s the job of Grafana and Prometheus — deep metrics, not just up/down. The two are complementary, and most mature homelabs run both.
Add your new monitor to your Homepage dashboard (there’s a built-in Uptime Kuma widget), and you’ve got eyes on the whole lab. Back to the roadmap for the next step.
Related posts:
- Proxmox Monitoring with Prometheus and Grafana — the deep-metrics layer that complements up/down checks
- Node Exporter + pve-exporter: Complete Proxmox Metrics — feed Grafana with host metrics
- Homepage Dashboard — surface Kuma status on your start page
- Tailscale Subnet Router — monitor and reach services remotely
- The Self-Healing Arr Stack — a real dead-man’s-switch push monitor in action
- One UPS, Whole Homelab: Safe Auto-Shutdown with NUT — watch the UPS and shut the lab down cleanly when the power fails
- The Docker localhost Trap: 24 Hours of Red, Zero Real Downtime — the #1 mistake to avoid when Kuma runs in Docker
- Real Screenshots, Zero Leaks: My Disposable Demo Lab — how this site photographs Kuma without exposing a real network
- Track AI Token Spend in Grafana: Claude, Codex, and Ollama — metrics-side monitoring for the AI stack, with alerts that don’t page on a sleeping laptop
- Homelab Capacity Planning: What If a Node Dies Tonight? — Kuma tells you a node died; this works out whether its containers fit anywhere else
Sources: Uptime Kuma (GitHub), Uptime Kuma wiki.
Comments
Comments are powered by GitHub Discussions — sign in with a GitHub account to join the conversation.