On this page
- Why bother measuring AI at all?
- Leg 1: Claude Code already speaks OpenTelemetry
- Leg 2: tail the agent’s log
- Leg 3: Ollama, measured from the outside
- Leg 4: the laptop, via Pushgateway
- The three PromQL traps that made v1 of the dashboard lie
- The privacy scrub: make your dashboards publishable
- Don’t page yourself over a dead exporter
- What it all shows
I let three different AIs work in my homelab every day — a coding assistant on my laptop, a second CLI for pair-work, and a small automated agent that triages alerts overnight. One evening I realized I couldn’t answer a basic question: what is all of this actually costing me? Two of them burn subscription quota I’ve already paid for, one spends real API dollars, and none of them showed up on the Grafana dashboards I’d built for everything else in the rack. So I spent an evening fixing that. By the end, every call from every AI in the lab — tokens, latency, cache hits, and dollars — landed in Prometheus and one Grafana dashboard.
This post walks through the four measurement legs, the PromQL traps that made my first dashboard lie to me, and the privacy scrub that makes the screenshots publishable.
Every machine-specific value in this post is a placeholder. Swap in your own before pasting anything: the monitoring host 10.0.0.5, the agent host 10.0.0.7, the Ollama nodes 10.0.0.1–10.0.0.3, the internal domain homelab.lan, exporter ports 9109/9110, and any file paths under /home/youradmin. If a value looks specific to one machine, it’s a placeholder to change — not a literal to copy.
Why bother measuring AI at all?
My lab already graphs everything else — I covered the base setup in Prometheus and Grafana on Proxmox. But the AI layer was invisible, and it has a genuinely weird cost structure. The two interactive CLIs run on flat subscriptions, so their “cost” is quota: a percentage of a weekly allowance. The automated agent calls a hosted model API directly and pays per token — at the time of writing, the small model it uses costs $1 per million input tokens, $0.10 per million cached input tokens, and $5 per million output tokens (Anthropic’s pricing page). Same lab, three billing models.
That’s why the dashboard has two distinct columns: quota burn (a percentage that resets) for the subscription tools, and real dollars for the metered agent. Once I could see both, the anxiety went away — the agent’s overnight triage runs cost cents, and the interesting number turned out to be the cache-hit rate, which is what keeps it that cheap.
Leg 1: Claude Code already speaks OpenTelemetry
The nicest surprise of the whole build: the coding CLI needs no wrapper at all. Claude Code has native OpenTelemetry support — OpenTelemetry being the vendor-neutral standard for shipping metrics out of applications. You switch it on with environment variables:
export CLAUDE_CODE_ENABLE_TELEMETRY=1
export OTEL_METRICS_EXPORTER=otlp
export OTEL_EXPORTER_OTLP_PROTOCOL=grpc
export OTEL_EXPORTER_OTLP_ENDPOINT=http://10.0.0.5:4317
Every session then exports metrics like claude_code.token.usage (by token type — input, output, cache read), claude_code.cost.usage in USD, and claude_code.session.count, with the model and session id attached as labels.
The catch: those metrics arrive over OTLP, the OpenTelemetry wire protocol, which Prometheus doesn’t scrape directly in my setup. The bridge is the OpenTelemetry Collector (the contrib build), a small service on the monitoring host that listens on :4317, applies processors — more on those in the privacy section — and re-exposes everything in Prometheus format on :8889.
Leg 2: tail the agent’s log
The automated agent doesn’t speak OpenTelemetry, but it writes an honest log line for every model call: provider, model, token counts, latency, whether the response came from cache, and the occasional “fallback activated” when it drops to a local model. That’s enough. A ~200-line Python exporter — standard library only, no pip installs — tails the log with a regex, keeps counters in memory, and serves them on :9109 in Prometheus text format. A systemd unit keeps it running as the agent’s own unprivileged user.
The same exporter reads the agent’s task database (read-only) and publishes queue-depth gauges, so the dashboard shows quality alongside spend: is the agent actually finishing its work, or just burning tokens?
When I deployed it, the exporter replayed the existing log and seeded itself with the agent’s whole history — 99 API calls and about 2.5 million input tokens at a ~78% cache rate. Then came the moment that made the evening worth it: I triggered one small agent task and watched ai_agent_api_calls_total tick from 99 to 100 on the dashboard. One call, traced end to end.
Leg 3: Ollama, measured from the outside
My three-node Ollama cluster — built here — was the stubborn one: Ollama doesn’t ship a Prometheus metrics endpoint (true as of the 0.30 releases I run). But it leaks everything you need in two places:
- Its request log. Every API hit produces an access-log line in journald with status code, latency, and caller IP. A second small exporter follows the journal and turns those lines into counters and histograms.
- The
/api/psendpoint. Officially documented, it lists which models are loaded into memory right now. Polling it gives you a residency gauge — handy for spotting a model that got evicted before a burst of requests paid the reload cost.
One exporter instance runs on each node at :9110. The caller-IP label turned out to be unexpectedly useful: it shows who is using the local models — the agent’s fallback path, the web UI, or me poking at things.
Leg 4: the laptop, via Pushgateway
The last leg is the second CLI on my laptop, Codex, which records token counts and rate-limit quota in its session files. Two problems: the laptop sleeps, moves, and disconnects — so Prometheus can’t reliably scrape it — and the interesting numbers only change while I’m logged in and working.
That’s the one shape of problem the Pushgateway exists for: a job Prometheus can’t scrape pushes its metrics to a small gateway service, and Prometheus scrapes the gateway. A systemd user timer on the laptop parses the session files every five minutes and pushes lifetime token totals plus the current quota percentage to :9091 on the monitoring host.
The Prometheus docs are blunt that the Pushgateway fits only limited cases, and this is one of them — but know its quirks. It never forgets: a pushed series is exposed forever until you delete it. And the Prometheus scrape job for it needs honor_labels: true so the pushed job labels survive instead of being renamed. Also remember a user timer only fires while you’re logged in — gaps in that graph are me being asleep, not an outage.
Wiring it all together is four scrape jobs in prometheus.yml:
scrape_configs:
  - job_name: ai_claude_code
    static_configs: [{ targets: ["10.0.0.5:8889"] }]   # OTel Collector
  - job_name: ai_codex
    honor_labels: true
    static_configs: [{ targets: ["10.0.0.5:9091"] }]   # Pushgateway
  - job_name: ai_agent
    static_configs: [{ targets: ["10.0.0.7:9109"] }]   # log-tail exporter
  - job_name: ai_ollama
    static_configs: [{ targets: ["10.0.0.1:9110", "10.0.0.2:9110", "10.0.0.3:9110"] }]
The three PromQL traps that made v1 of the dashboard lie
My first dashboard rendered beautifully and was wrong three different ways. Each trap is worth knowing before you build yours.
Trap 1: per-session counters break increase(). Claude Code’s counters are per-session and ephemeral — a new session starts a new series, and a short session may leave only a single sample in your query window. Prometheus range functions need at least two samples to compute anything, so increase() returns nothing and the panel shows zero — while a real 30,000-token session sits invisible in storage. The fix is to read the last value each session reported and add sessions together:
sum(max_over_time(claude_code_token_usage_tokens_total[1d]))Trap 2: composite cost math collapses on absent series. My spend panel multiplied input, cache-read, and output token rates by their prices and added them up. When the lab had produced no cache reads yet, that series simply didn’t exist — and in PromQL, arithmetic with an empty operand makes the whole expression empty. Real spend rendered as $0.00. Guard every component:
(sum(rate(input_tokens[1h]))  or vector(0)) * 1.00 / 1e6
+ (sum(rate(cache_tokens[1h])) or vector(0)) * 0.10 / 1e6
+ (sum(rate(output_tokens[1h])) or vector(0)) * 5.00 / 1e6
Trap 3: histogram_quantile returns literal NaN over idle windows. With zero observations in the window, the function returns NaN — documented behavior, not a bug — and my latency panel dutifully drew garbage across every quiet hour. Anything consuming these series needs to drop non-finite samples; in Grafana panels the graph just goes sparse when the lab is idle, which is the honest picture anyway.
The privacy scrub: make your dashboards publishable
Here’s the part I’d call mandatory if you ever screenshot a dashboard for a blog, a talk, or a support thread. Claude Code’s telemetry attaches identity by default: your email address, account ids, and organization id ride along as labels on every metric. Useful in a company; radioactive on a public screenshot.
Two-part fix. Going forward, the OTel Collector deletes those attributes before they ever reach Prometheus, using its attributes processor and resource processor — both support a delete action:
processors:
  resource/scrub:
    attributes:
      - { key: user.email,        action: delete }
      - { key: user.account_uuid, action: delete }
      - { key: user.account_id,   action: delete }
      - { key: user.id,           action: delete }
      - { key: organization.id,   action: delete }
  attributes/scrub:
    actions:
      - { key: user.email,        action: delete }
      - { key: user.account_uuid, action: delete }
      - { key: user.account_id,   action: delete }
      - { key: user.id,           action: delete }
      - { key: organization.id,   action: delete }
Deleting by key (not by value) matters: anyone who ever exported from that laptop gets scrubbed, not just the account you thought of.
For the history already on disk, Prometheus has a TSDB admin API — disabled by default, and it should stay that way. Open a temporary window: restart Prometheus with --web.enable-admin-api, delete the identity-labeled series, clean up, and close the window:
curl -X POST 'http://10.0.0.5:9090/api/v1/admin/tsdb/delete_series?match[]={user_email!=""}'
curl -X POST 'http://10.0.0.5:9090/api/v1/admin/tsdb/clean_tombstones'
# now remove --web.enable-admin-api from the unit and restart again
Verify with instant queries for each identity label — they should all come back empty — then confirm the admin API answers 403/404 again.
One deliberate non-deletion: I kept the session_id label. Dropping it looks like a privacy win, but merging per-session cumulative counters without a real aggregation step makes distinct sessions collide into one series — last write wins, values flap, totals undercount. Scrub identity, keep cardinality that’s structurally load-bearing.
Don’t page yourself over a dead exporter
My Node Down alert used to be up == 0 — any scrape target down meant a page, as I set up back in the node-exporter post. The laptop legs made that untenable: a sleeping laptop is not an outage. The alert is now scoped to exclude the AI jobs:
up{job!~"ai_.*"} == 0A dead AI exporter shows as a gap on the dashboard, which is the severity it deserves. Real infrastructure still pages. (My uptime philosophy for user-facing checks lives with Uptime Kuma — this alert is only about hosts.)
What it all shows
The finished dashboard has a spend/quota strip on top — real dollars for the metered agent, weekly-window percentages for the two subscription CLIs — then token throughput by tool and model, cache-hit rate, latency quantiles that politely go sparse when the lab sleeps, and the agent’s task-queue gauges. Total cost of the measurement layer itself: two tiny Python exporters, one collector, one gateway, and an evening.
Once the numbers live in Prometheus, any client can render them. Mine also surface in the Metrics tab of my homelab dashboard app, same PromQL, no Grafana in the loop:
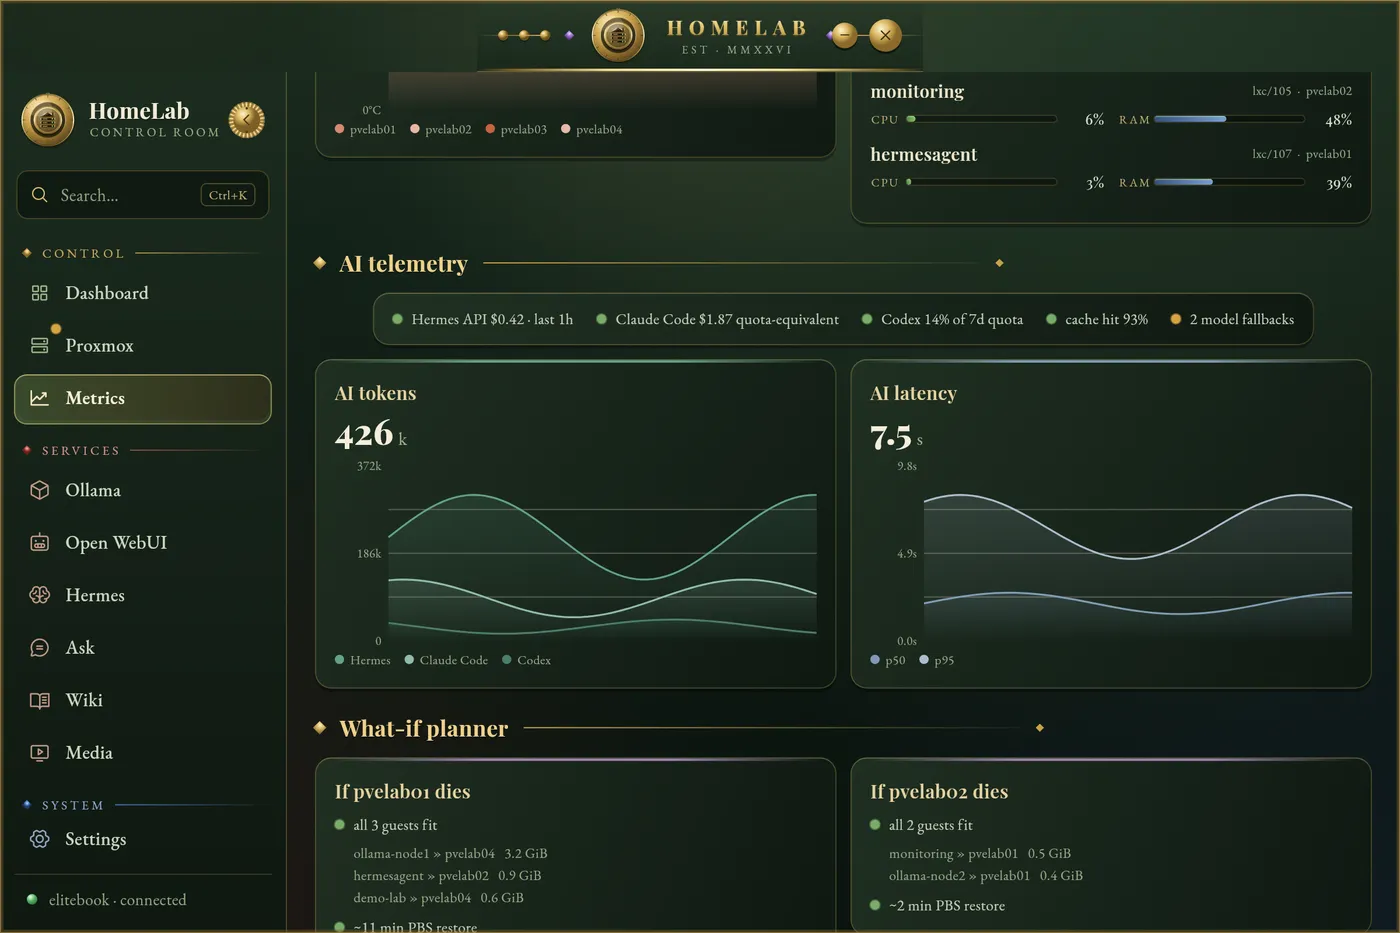
The number I actually watch daily isn’t spend — it’s the cache-hit rate. At ~78% cached input, the agent’s metered bill stays in coffee money. The day that rate drops is the day something changed in how it builds prompts, and now I’ll see it the same morning. If you’re running an agent like mine, the Hermes agent setup post covers the thing being measured here.
Related posts:
- Monitor Proxmox with Grafana and Prometheus — the base monitoring stack this telemetry layer plugs into
- Node Exporter dashboards for every Proxmox node — where the Node Down alert scoped in this post comes from
- Build a three-node Ollama cluster in LXC — the local inference nodes measured by the journald exporter
- Hermes: an AI agent for your homelab — the automated agent whose spend and queue health this dashboard tracks
- Open WebUI beyond the basics — another consumer of the Ollama nodes you’ll see in the caller-IP labels
- Uptime Kuma: monitoring that tells you when things break — service-level checks that complement these metrics
- Homelab Capacity Planning: What If a Node Dies Tonight? — the other “measure what you were guessing about” build, this time for failure recovery
Comments
Comments are powered by GitHub Discussions — sign in with a GitHub account to join the conversation.