There’s a rite of passage in every homelab. You add a fifth service, go to open the fourth one, and realise you can’t remember whether Sonarr is on port 8989 or 7878, or which of the three IP addresses in your browser history is the wiki. Your bookmarks bar is a graveyard of 192.168.1.x:some-port.
Homepage ends that. It’s a single, fast, self-hosted start page that links to everything you run — and, crucially, shows live information on each tile: how many ads Pi-hole blocked today, what’s downloading in Sonarr, your Proxmox node’s CPU and RAM, right there on the dashboard.
Homepage is configured with plain YAML files (no clunky admin UI to fight), it starts in milliseconds, and it can even auto-discover services straight from your Docker labels. Let’s stand it up.
Install Homepage
Homepage runs as a single container. On your Docker host, create a config folder and run it. There’s one gotcha that catches everyone, so we’ll handle it up front.
For security, Homepage refuses any request whose address isn’t on an allow-list, and if you skip this you’ll get a blank page or a “host validation failed” error. You must set the HOMEPAGE_ALLOWED_HOSTS environment variable to exactly how you’ll open the dashboard — including the port. This is the number-one reason a fresh Homepage install “doesn’t work.”
Make a folder and a docker-compose.yml. Note the docker socket mount — it’s optional, but it’s what lets Homepage auto-discover containers and show Docker stats.
services:
homepage:
  image: ghcr.io/gethomepage/homepage:latest
  container_name: homepage
  ports:
    - "3000:3000"
  volumes:
    - ./config:/app/config
    - /var/run/docker.sock:/var/run/docker.sock:ro   # optional: auto-discovery
  environment:
    # Set this to how YOU reach the dashboard, port included:
    - HOMEPAGE_ALLOWED_HOSTS=192.168.1.50:3000
  restart: unless-stopped
Bring it up. On first run Homepage writes a set of starter YAML files into your ./config folder.
docker compose up -d
Open http://YOUR-HOST-IP:3000 and you’ll see a default dashboard. Now the fun part — making it yours.
Configure it: four little YAML files
Everything Homepage shows comes from files in the config folder. You only need three to start:
Edit config/services.yaml to add your own services, grouped however you like. Here’s a real example — notice the widget block on Pi-hole: that’s what pulls live stats onto the tile.
- Infrastructure:
  - Proxmox:
      href: https://192.168.1.10:8006
      description: Virtualization host
      icon: proxmox.png
  - Pi-hole:
      href: http://192.168.1.20/admin
      description: Network ad-blocker
      icon: pi-hole.png
      widget:
        type: pihole
        url: http://192.168.1.20
        key: YOUR_PIHOLE_API_TOKEN

- Media:
  - Jellyfin:
      href: http://192.168.1.30:8096
      description: Movies and TV
      icon: jellyfin.png
Homepage has built-in widgets for over 100 apps — Proxmox, Sonarr, Radarr, qBittorrent, Immich, Uptime Kuma, Home Assistant, and more. Add a widget block with the service’s API key and the tile starts showing real data: queue counts, streams, temperatures, blocked-ad totals. Browse the full list in the Homepage docs and copy the block for each app you run.
For the top-of-page info widgets — a clock, the weather, and a live glance at the host’s own CPU, memory, and disk — edit config/widgets.yaml:
- resources:
  cpu: true
  memory: true
  disk: /

- datetime:
  text_size: xl
  format:
    timeStyle: short
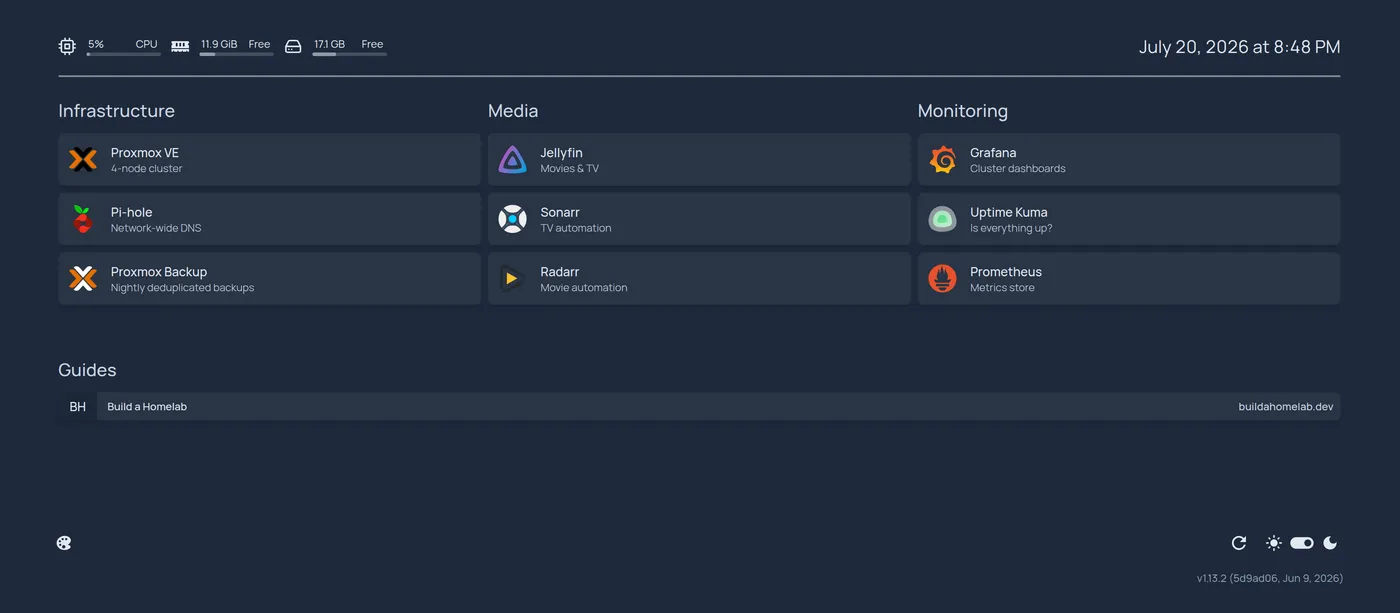
Save any file and Homepage reloads on its own — no restart, no rebuild. Tweak, refresh, repeat until it’s exactly the cockpit you want. Here’s the result of exactly the YAML above — three groups, nine tiles, live host stats in the top bar:
Make it your browser home page
The finishing move: set http://YOUR-HOST-IP:3000 as your browser’s home page and new-tab page on every device. Now every time you open a browser, you land on a live map of your entire homelab — one click to any service, health of everything at a glance.
Pair it with Uptime Kuma for at-a-glance up/down status, reach it from anywhere over Tailscale, and you’ve turned a pile of ports into something that genuinely feels like your private cloud. Back to the roadmap for what’s next.
Related posts:
- Uptime Kuma: Dead-Simple Homelab Monitoring — add up/down status to your dashboard
- Proxmox Monitoring with Prometheus and Grafana — deep metrics to link from Homepage
- Pi-hole on Proxmox LXC — a service tile that shows live ad-block stats
- Tailscale Subnet Router — reach your dashboard from anywhere
- What Is a Homelab? — the services this dashboard ties together
- The Docker localhost Trap: 24 Hours of Red, Zero Real Downtime — why a monitor pointed at
localhostcan’t see this dashboard - Real Screenshots, Zero Leaks: My Disposable Demo Lab — the throwaway environment behind this guide’s screenshots
Sources: Homepage documentation, Homepage (GitHub).
Comments
Comments are powered by GitHub Discussions — sign in with a GitHub account to join the conversation.